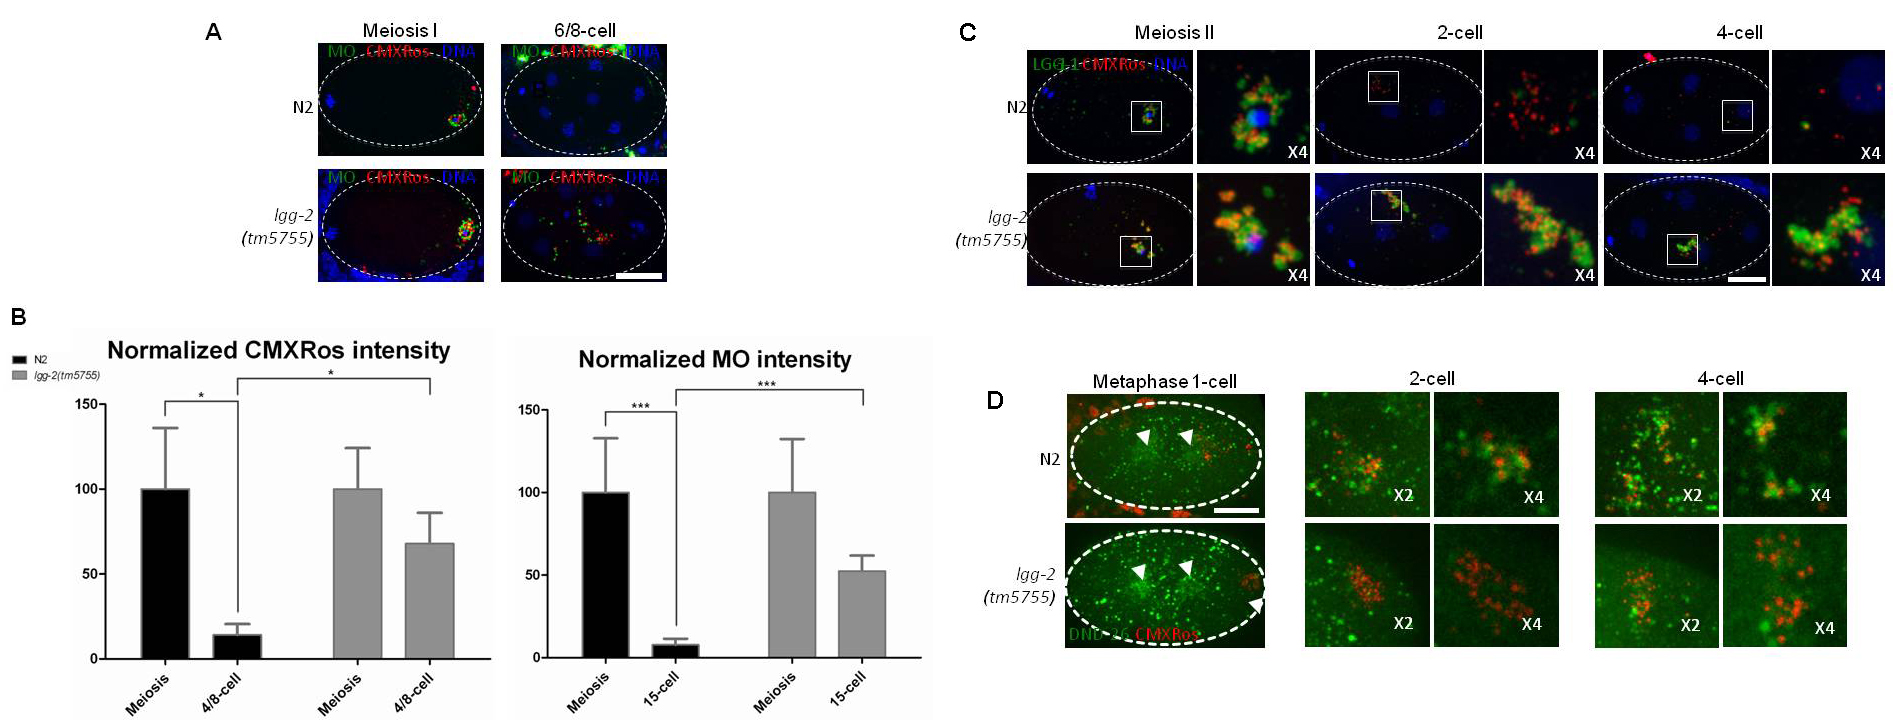
Figures edited for a scientific publication of Mr. Vincent Galy's laboratory (CNRS UMR7622, Paris) : Figure A - Comparison between 2 wild type C.elegans embryos and 2 lgg-2 mutant embryos (tm5755), each of them from different developmental stages : meiosis I or 6-8 cells. Immunofluorescent staining : membranous organelles (green), paternal mitochondria (red), DNA (blue). Figure B - Quantification results for fluorescent signals in wild type or mutant C.elegans embryos, comparison between embryos at meiosis and late developmental stages (4-8 cells for mitochondria fluorescent signal quantification and 15-cells for membranous organelles fluorescent signal quantification) Figure C - Comparison between wild type and mutant C.elegans embryos for 3 different development stages : meiosis II, 2-cells and 4-cells, Immunofluorescent stainings : LGG-1 proteins (green), paternal mitochondria (red) and DNA (blue). Figure D : Comparison between wild type and mutant C.elegans embryos for 3 different development stages : metaphase, with zoom on 2-cells and 4-cells. lysosomes are marked by Lysotracker (green) and paternal mitochondria by CMXRos. Arrows point at centrioles of the embryo.